
For franchisees running 100 to 2,000 units
Close it, convert it,
or open nearby.
See what the move does to the rest of your network before you sign. A closure hands demand back to the stores around it. A conversion trades one brand's customers for another's. A new store takes from the ones you already run. The franchisor's site model was built to approve openings, not to answer any of that.
Geod is network scenario software for multi-brand franchisees: simulate the move against the portfolio you already run, and take numbers to the committee that show their work.
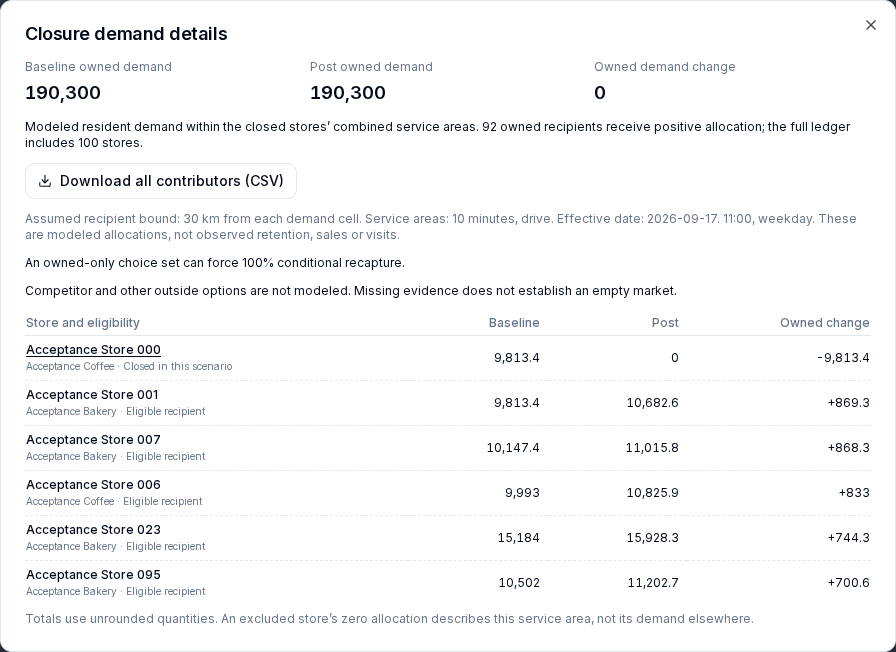
Actual app output with synthetic inputs. View the example and download the PDF.
From your portfolio to a decision you can defend
Load your network
Upload your locations once, brands and combo stores included. Stores, openings, and closings become the baseline every analysis starts from, so the whole team works from the same portfolio.
Simulate the move
Close a store, convert it to another brand, or open nearby. Demand shifts are computed store by store: what nearby stores win back, what the move gives up, what competitors take.
Brief the committee
One-click PDF with the analysis date, verified source dates, and a clear note wherever a data date is unknown. Reopen the saved analysis next quarter and its numbers still match.
What the brief shows
Every analysis answers four questions, with sources, timestamps, and full methodology attached.
What happens to your stores?
Per-store impact, by name: the demand a closure releases or an opening captures, what each nearby store loses or wins back, and net new versus transfer. Before committee, not after the move.
How crowded is it, for this brand?
The same competitor matters differently to different concepts. Each one is weighted by how substitutable its category is with the brand you are evaluating, in a table you can read.
Who can reach the site?
Trade areas built from drive time, not circles. 5pm traffic differs from 10am; weekend differs from weekday. The brief shows the catchment your customers actually face.
How much demand is there?
Residents, households, income, and density wherever the source data covers the trade area. Briefs show source dates, flag unknown ones, and report demand as residents, never as revenue.
Built to survive a hostile question
Committees approve analyses they can interrogate. Every number in Geod shows where it came from and what it assumes.
Analyses stay pinned
Every analysis records the data snapshot and date it was computed against, and holds still until you choose to refresh. The export always agrees with the screen.
Scores decompose
No naked scores. Every composite opens into its components, each with a raw value, a weight, and a contribution the committee can argue with.
Missing means missing
When a number cannot be computed honestly, the brief marks it omitted instead of filling it in. When a question has no meaningful answer, such as adding a brand to a store that already runs it, the model declines and explains why.
Predictions go on record
Claims are stored with their assumptions and a due date, and are reconciled against actual outcomes as they arrive, so the model builds a track record you can inspect.
The core workflows
Geod turns trade area analysis, cannibalization analysis, market saturation analysis, and white space analysis into one explainable brief for the move you are weighing.
Trade area analysis
Define drive-time trade areas, reachable demand, and catchment assumptions.
Cannibalization analysis
Separate gross candidate demand from same-brand transfer and net-new value.
Market saturation analysis
Measure supportable units, overlap, cohort signals, and marginal contribution.
White space analysis
Find underserved markets with feasible access, demand, and confidence checks.
Built on public and licensed datasets
Briefs show verified source dates and flag unknown vintages or coverage gaps. Logos and trademarks belong to their respective owners; use of data does not imply endorsement.
Start free. Pay when your network is in view.
Site
Free. Drop a pin and get a trade-area brief: demographic estimates, a preview of nearby competitor counts, and a score you can open into its parts, wherever data coverage supports them. Up to 25 managed locations. Full competition mapping and network math come with Network.
Network
Your network as the baseline. Upload the portfolio, simulate closures, conversions, and openings, and see per-store transfer and recapture before the decision is made. 14-day trial, no card.
Consultants, black-box scores, and one-off spreadsheets share one weakness: ask the same question twice and you can get two answers. In Geod, a saved analysis gives the same answer until you choose to refresh it.
Bring the decision
you're weighing now.
A closure, a conversion, or an opening. Run it through Geod and compare the brief with what your current process produces.
Check the math against your own last closures
Ninety days, $9,000, credited toward an annual agreement. We load your network, model the closures and conversions you already made against the network as it stood, and reconcile each prediction against your actual sales. You see the error before you rely on the model.