
Features
The tools to run your network as a system: simulate the move, defend the numbers, keep the record.
Geod answers four questions for any move: Who can reach the site? How much demand is there? How crowded is it for your brand?
And the one that decides careers: what happens to the stores you already have?
The Move
Simulate the move, store by store
A closure, a conversion, or an opening moves demand across your whole network. Geod computes where it goes, per store, by name, against the network as it stands on the effective date.
Included with Network PlanSample network
One candidate site against one nearby store.
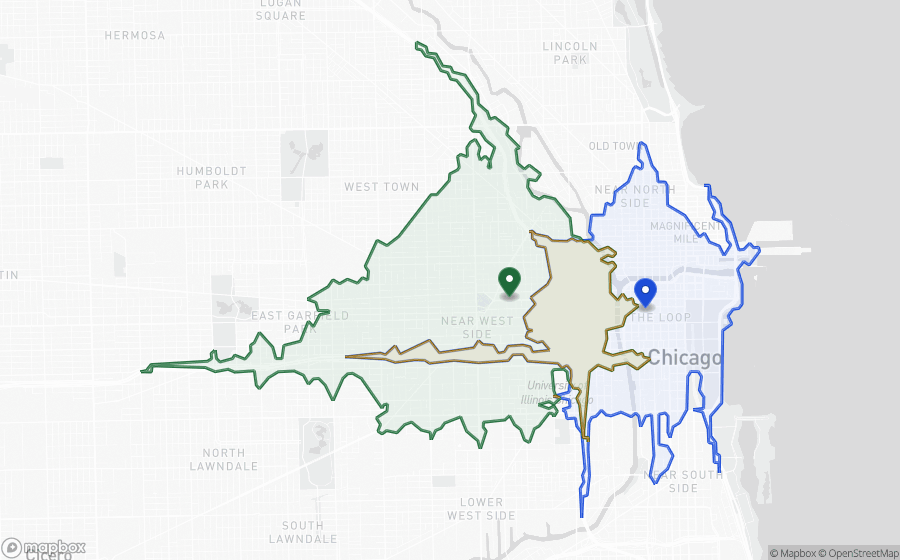
Trade area overlap
34%
Net new demand
82%
Most exposed
Store #47
Transfer, not just overlap
NetworkOverlap is an input. Geod allocates the residents of each map cell across your stores and the competitors that could serve them, so the number in the brief is expected demand transfer, not the share of one circle that crosses another.
Store-level impact
NetworkWhich specific stores are affected, and by how much, ranked by exposure. Closures show what nearby same-brand stores win back and what leaks to competitors; conversions show both sides of the swap.
Net new demand
NetworkGross opportunity minus estimated transfer. “82% of this site's demand is net new to your network.”
Predictions on record
NetworkEvery closure or conversion brief registers its predicted transfer with its assumptions and a due date. When your sales come in, Geod reconciles predicted against actual, store by store.
Why it matters
The franchisor's site model was built to approve openings. It has nothing to say about closing a store or converting it, and those are the decisions where the network math matters most.
The Brief
The brief
Every analysis produces a brief the committee can interrogate. When a score can be computed, its components are visible. Missing inputs are named, not filled in.
Score with breakdown
When supported, a composite score with its components visible:
74 = Reach (28) + Demand (31) + Competition (-12) + Accessibility (27)Disagree with a weight? You can see exactly what to adjust.
Methodology note
Data sources, snapshot date, and assumptions are documented in the brief itself, so it can be audited months after the decision. The numbers stay pinned until you ask for a refresh.
See a synthetic sample briefLive app view
Places list and site brief in view.
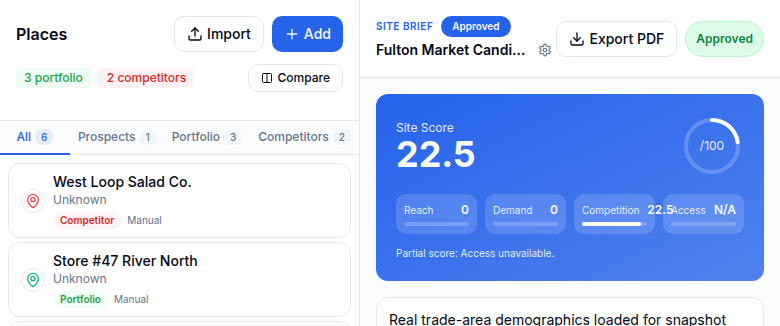
What's in the brief
Network impact
For a closure, conversion, or opening: released or captured demand, per-store transfer and recapture by name, and net new versus transfer.
Trade area
Time-aware catchments for 5, 10, and 15-minute drive times. See how the trade area shifts by time of day: morning commute, lunch, evening. Not a static radius.
Demographics
Supported population, household, income, age, and density estimates for your trade area. Briefs flag unknown vintages or missing source cells.
Competition
Covered trade areas show category-matched indexed place-record counts and density. Network briefs can list nearby records or use your curated competitors.
Co-tenancy
Nearby anchors and traffic generators when source evidence supports them; otherwise the brief marks them unavailable.
Trade Areas
Trade areas based on how people drive
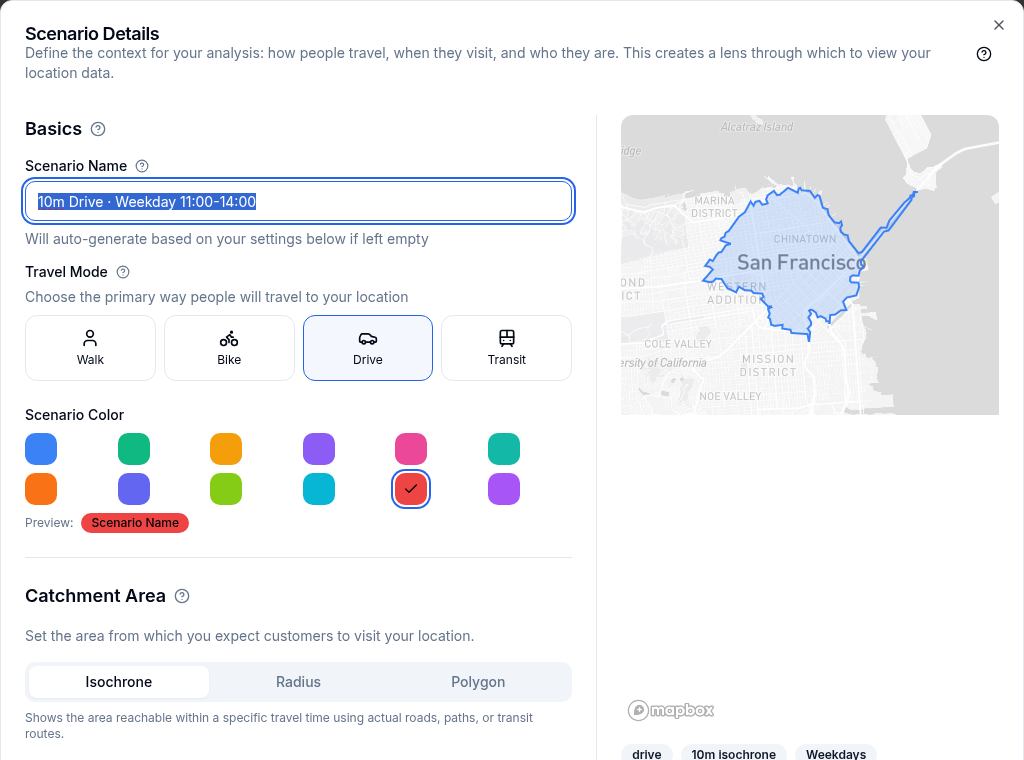
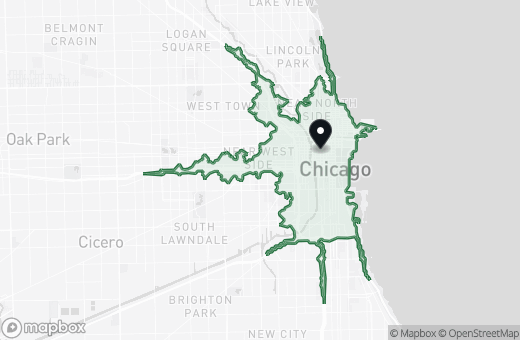
A 3-mile radius ignores highways, rivers, and traffic. Geod builds trade areas from drive times and lets you see how they change.
Trade area setup
Configure travel mode, catchment, and time window once, then review the same site across departure times.
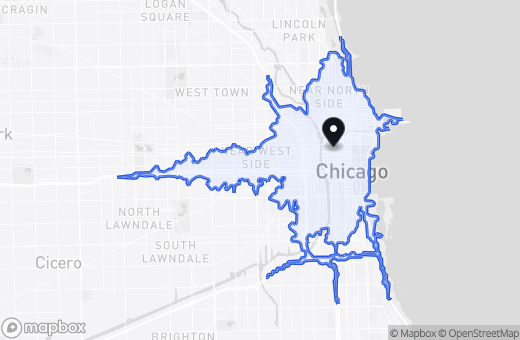
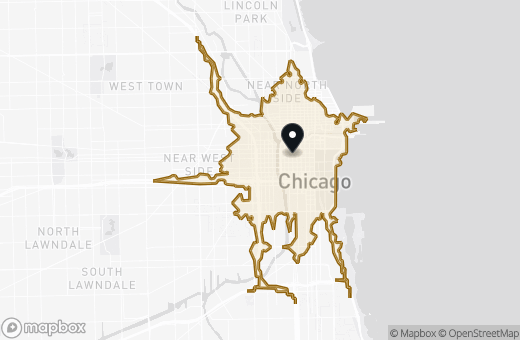
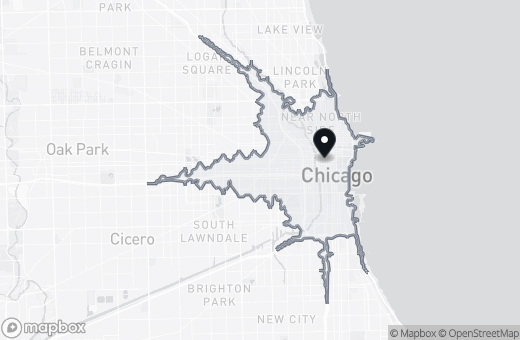
By time of day
A breakfast spot's 10-minute trade area at 7am is different from a bar's at 10pm. Rush hour traffic reshapes catchments.
By day of week
Weekend vs. weekday traffic patterns can shift your reachable population by 20-30%.
By travel mode
Drive, walk, or transit, depending on your concept and market.
Why it matters
The site that looks great at 2pm on a Tuesday might be inaccessible when your customers actually show up.
Explainability
Scores that show their work
Black-box scores don't survive committee. "The model says 78" isn't an answer when the CFO asks why.
Formula visible
Every score is a weighted sum of components. You see the formula, the inputs, the weights.
Why it matters
When you can show your math, decisions get approved faster.
Components broken out
Reach contributed 28 points. Demand contributed 31. Competition subtracted 12. Accessibility added 27. Now you can discuss trade-offs.
Sources cited
Briefs identify supported inputs and flag unknown source vintages or coverage gaps.
Reproducible
Run the same analysis in six months and get the same answer. Refresh is an explicit act, and the record keeps both versions. Deterministic IDs and snapshot timestamps.
Your Model
Define your strategy once
You know what makes a site work for your brand. Geod helps you make it explicit.
Included with Network PlanSet your criteria
NetworkMinimum population threshold. Target income range. Maximum competitor density. Required anchor proximity. Your rules, encoded.
Set your weights
NetworkIs income twice as important as population for your concept? Adjust the weights. The model reflects your strategy, not ours.
Save and version
NetworkYour model is saved and versioned. Update it as you learn. See how scoring changes over time.
Apply everywhere
NetworkApply your selected model to new pins and uploaded candidates. Supported inputs produce a score; missing inputs stay visible instead of becoming invented values.
Why it matters
Tribal knowledge becomes institutional knowledge. The whole team evaluates sites the same way.
Portfolio
Your network is the baseline
Upload your locations once and they become the durable record every analysis starts from: coverage, gaps, overlaps, and history.
Included with Network PlanSample network
Four sample sites and their catchments across one metro.
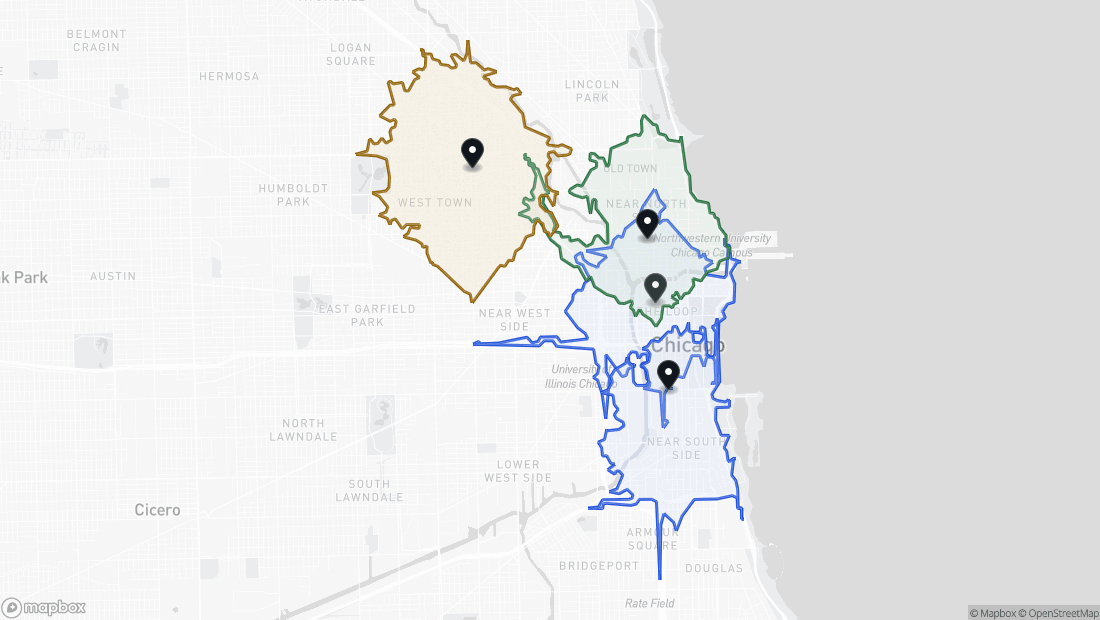
Sites shown
4
Overlap clusters
2
Catchment
7 min
Upload your stores
NetworkAddresses, brands, store numbers, open dates. Stores that house two brands at once are modeled as such. Your portfolio becomes the baseline.
Upload competitors
NetworkYour competitive set, tracked the way you define it. Supplement our POI data with your intel.
Coverage map
NetworkWhere are you strong? Where are the gaps? Which markets are saturated vs. underpenetrated?
Batch scoring
NetworkUpload 50 candidates. Score them all against your model. Rank by fit. Export the shortlist.
Why it matters
Single-site analysis misses the network effects. Portfolio view catches what pin-drops miss.
Export
Board-ready output
The analysis is only useful if it survives the meeting.
One-click PDF
Brief with maps, tables, methodology, and score breakdown. Formatted for committee, not for analysts.
Presentation-ready maps
Trade area, competition, demographics: exportable images you can drop into a deck.
Consistent format
Every brief looks the same. Compare Site A to Site B without reformatting. Build institutional muscle memory.
Audit trail
When it was run, against which data snapshot, with which model version. The analysis stays pinned, so the brief a board reviews next year says what it said in the meeting.
Data Included
Data you don't have to buy separately
All plans include:
Demographics
Population, households, income, and other demographic estimates where supported. Briefs identify verified sources and vintages.
Competition
Category-matched Foursquare place records where the full trade area has verified indexed coverage. Source dates and limits appear in the brief.
Source provenance
Briefs distinguish known source dates from unverified vintages and disclose missing market evidence.
Boundaries
Census and TIGER/Line boundaries for supported areas and layers; coverage and vintages vary.
Need parcel, zoning, mobile visit, traffic, or your own datasets pulled in? Contact us.
No data fees
Flat subscription. Analyze as many sites and moves as you want without worrying about per-query costs.
Need traffic counts, foot traffic, or psychographics? We can integrate third-party sources for Enterprise plans.
Next Step
See it on a real move
Pick a store you're weighing closing or converting, or a site you're evaluating. Run it through Geod. Compare the output to what you'd get from your current process.