
Synthetic example · actual app output
A closure brief you can inspect
One store closes. See how modeled resident demand moves across a 100-store example network.
Fictional businesses, synthetic demand and routing. This demonstrates the workflow, not customer results or observed sales.
Download sample PDFNo email or account required. Sources and limitations are included in the PDF.
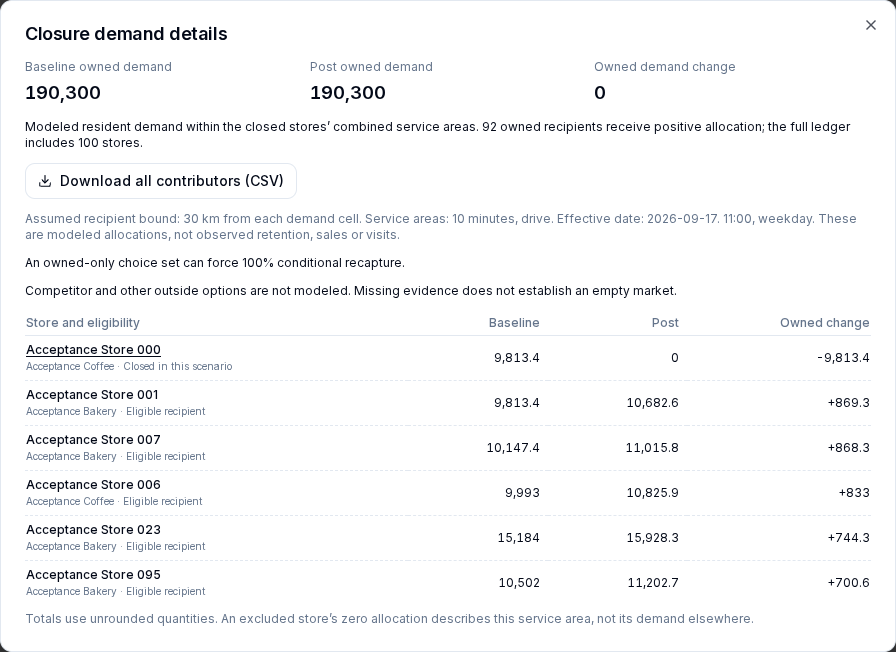
The transfer ledger, captured from Geod
The closed store loses its modeled allocation. Recipient stores gain demand within the evaluated service area. This owned-only choice set excludes competitors and outside options, so it can force 100% conditional recapture. That is not observed retention, visits, sales or profit.
What went into this example
- 100 fictional store and brand records at 99 public restaurant addresses, including a two-brand combo site. Addresses came from OpenStreetMap on September 12, 2026. They do not identify the businesses operating at those addresses.
- Demand uses synthetic H3 values and formula-generated Site fixtures, not observed Census measurements. The report’s 2025Q3 snapshot is a fixture label, not a verified survey vintage.
- Routing uses synthetic geometry. The 10-minute drive setting and weekday departure are test assumptions, not measured travel times.
- Competition, accessibility, verified traffic and the offline map are unavailable. The Site catchment and score are separate from the closure service area.
Generated September 17, 2026 by the current app engine. Calculated figures are preserved; the PDF adds example notes and removes private workspace links and QR codes.
Address data © OpenStreetMap contributors, ODbL. Read the full address attribution.